China Top 10 Electric Motor Drive Suppliers?

Time:2026-11-01 Author:Sienna
0%

China is home to a broad mix of manufacturers serving industrial automation, machinery, transport, and energy projects. This guide to China’s top 10 Electric Motor Drive suppliers offers a practical starting point for buyers comparing potential partners. It focuses on factors that matter beyond a polished product page: application experience, product range, technical documentation, customization, production capability, and after-sales support.

The right supplier depends on the job. A drive for a factory pump may need stable speed control and straightforward commissioning, while a production line may require precise coordination with motors, sensors, and control systems. Ask for clear specifications, operating limits, communication options, and test information. Request evidence for claims that affect your design. Details matter. A low quoted price can look attractive, but installation, training, spare parts, and response times also shape the real cost.

No single ranking can fit every buyer. Supplier capabilities change, and public information may not reveal quality-control practices or service performance. Treat this list as a research aid, not a final endorsement. Verify certifications relevant to your market, discuss the intended duty cycle, and assess how the supplier handles technical questions. We may not capture every strong manufacturer, and that is worth acknowledging. Careful comparison, direct communication, and application-specific checks can help narrow the field with more confidence.
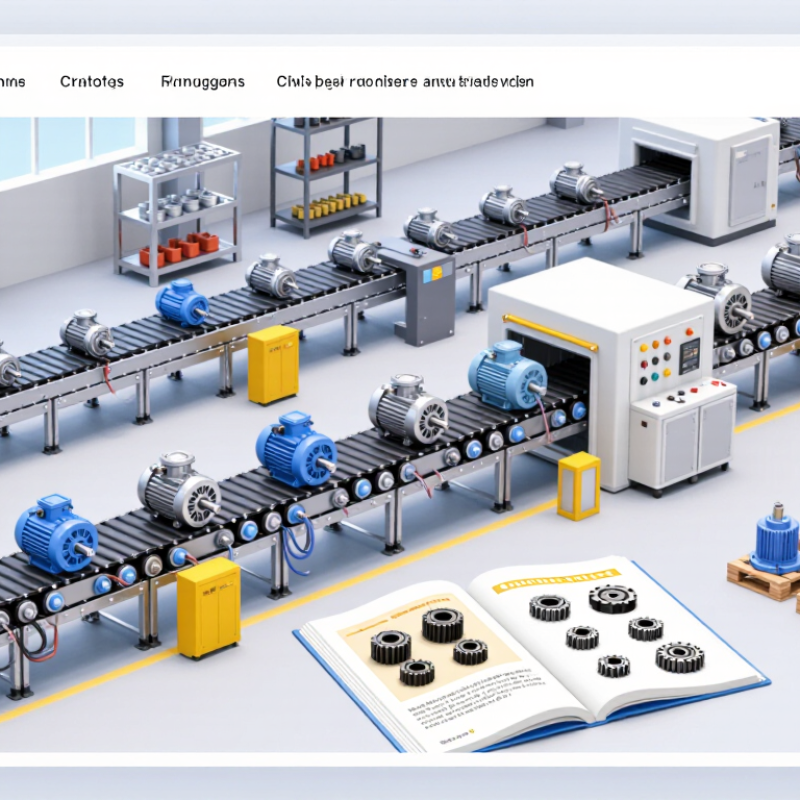
China Top 10 Electric Motor Drive Suppliers?

China’s 9.59 Million NEVs in 2023: Market Demand for E-Drive Suppliers

China Top 10 Electric Motor Drive Suppliers?

China’s 9.59 Million NEVs in 2023: Market Demand for E-Drive Suppliers

China’s NEV market reached a new scale in 2023. The China Association of Automobile Manufacturers reported 9.587 million NEVs produced and 9.495 million sold. For e-drive suppliers, that means substantial demand for traction motors, inverters, and integrated drive units. The International Energy Agency also reported that China accounted for around 60% of global electric car sales that year. The numbers are compelling. But they do not translate directly into orders for every supplier.

Vehicle mix matters. Battery-electric and plug-in hybrid models use different drive configurations, while automakers make varied choices about component integration and sourcing. Suppliers must meet requirements for efficiency, power density, thermal control, and dependable production at scale. On a factory line, even a small delay in motor or inverter delivery can disrupt assembly schedules. Yet volume alone is not enough. Price pressure is real, and technology changes quickly. That part is easy to underestimate. CAAM’s figures show market size, not supplier profitability or future contracts. For buyers comparing China’s e-drive sector, production capacity, testing records, and long-term service support deserve close attention.

China’s NEV Market in 2023: Scale and E-Drive Demand

China produced 9.587 million new energy vehicles (NEVs) and sold 9.495 million in 2023, up 35.8% and 37.9%, respectively, from 2022. This rapid market expansion indicates growing demand for electric-drive systems; the figures represent total NEVs, not e-drive supplier shipments.

Source: China Association of Automobile Manufacturers (CAAM). Figures are in millions of vehicles.

How an E-Drive Combines the Motor, Inverter, and Reducer

An electric drive, or e-drive, combines a motor, inverter, and reducer in one coordinated system. The motor converts electrical energy into rotation. The inverter controls how much current reaches the motor and adjusts its speed. The reducer uses gears to lower motor speed and increase torque at the wheels. Together, these parts affect acceleration, efficiency, noise, and heat. Small details matter.

In practical evaluation, listen for gear whine and check how quickly the unit warms under repeated load. A compact housing can save space, but it may leave less room for cooling or service access. The inverter and motor must also work within compatible voltage and temperature ranges. Supplier comparisons should include efficiency maps, cooling requirements, control response, and durability test conditions—not just peak power. Numbers can look tidy on a specification sheet; real operating cycles are messier.

Tips: Ask for operating data across different speeds and loads. Check connector placement, coolant routing, and vibration behavior. If test conditions are unclear, treat the results cautiously.

400 V and 800 V Platforms: Key E-Drive Voltage Architectures

Electric motor drive design often begins with a voltage choice. A 400 V platform is a familiar balance for passenger vehicles, offering manageable insulation requirements and broad component availability. At the same power level, however, it draws more current than an 800 V system. That means thicker conductors and greater attention to heat in cables, connectors, and power electronics.

An 800 V architecture can reduce current for a given output, helping limit resistive losses and support faster charging when the battery and charging equipment are designed for it. It also brings tougher demands: insulation, switching devices, testing, and service procedures must all suit the higher voltage. The benefits are not automatic. Real roads disagree.

For drive suppliers, the practical question is how well the inverter, motor, gearbox, and cooling system work together across the vehicle’s operating range. A compact 800 V inverter may look impressive on a specification sheet, yet thermal performance under repeated acceleration matters more. Engineers should compare efficiency maps, peak and continuous power, packaging, and fault-handling behavior. Small details count. Even a connector choice can affect assembly and long-term reliability. A voltage label alone is not enough.

Ten Leading Chinese Suppliers: Products, Integration, and Market Roles

China’s electric motor drive suppliers serve different needs, so a useful top-ten comparison should look beyond sales rankings. Their portfolios may include variable-frequency drives for pumps and fans, servo systems for precise motion, and traction drives for electric vehicles. Some suppliers focus on compact units for factory machines. Others provide higher-power systems for infrastructure or transport.

Product fit matters. Check rated voltage, overload capacity, cooling method, and control compatibility against the actual motor and operating cycle. A drive that handles a brief peak may still struggle with repeated starts in a hot enclosure. Small details count. Integration also varies: some suppliers offer motor-drive packages, commissioning support, and monitoring tools, while others primarily deliver components. Ask how firmware updates, spare parts, and technical support are handled after installation. These practical services can affect uptime as much as the published specifications.

The suppliers’ market roles reflect China’s broad manufacturing base, including automation, energy systems, and vehicle production. Yet “leading” can mean different things: shipment volume, engineering capability, export reach, or strength in a particular sector. Public rankings may not use the same criteria, so comparisons deserve caution. A shortlist is only a starting point. Request test data under relevant loads, verify interface requirements, and assess support near the intended installation site. Specs don’t tell the whole story.

How to Compare Suppliers by Power, Torque, Efficiency, and Reliability

When comparing electric motor drive suppliers, match power and torque to the actual duty cycle, not just the catalogue maximum. Ask for continuous and peak torque curves across the required speed range, including field weakening and overload duration. A 30 kW rating says little if the machine must deliver high torque during repeated starts. The IEA’s 2011 report, Energy-Efficiency Policy Opportunities for Electric Motor-Driven Systems, estimates these systems use about 43–46% of global electricity. Small efficiency gaps matter.

Compare efficiency at several load points, and check whether figures cover the motor alone or the complete drive system. IEC 61800-9-2 provides a framework for assessing drive-system losses. Request test conditions, cooling requirements, and derating curves; otherwise, two quoted percentages may not be comparable. For reliability, review warranty terms alongside documented operating hours, failure records, thermal limits, and vibration-test results. A spreadsheet can still miss installation details.

Tips: Send every supplier the same speed-torque profile and ambient-temperature range. Ask for a sample test report. Check bearing and insulation temperature limits. Treat unsupported lifetime claims cautiously; real service data is often imperfect, but useful.

China Top 10 Electric Motor Drive Suppliers? - How to Compare Suppliers by Power, Torque, Efficiency, and Reliability

Comparison guide: The ten rows below represent common electric motor and drive supplier capability profiles, not ranked or verified company listings. Figures are indicative product-market ranges, not quotations or guarantees; confirm the exact operating point, test conditions, and certification in each supplier’s datasheet.

No. Supplier Capability Profile Typical Motor Power Example Rated Point Calculated Shaft Torque Indicative Motor Efficiency at Rated Load Typical Drive Efficiency Reliability Checks to Compare
1 Low-voltage induction motor and inverter supplier 0.75–315 kW 15 kW at 1,500 rpm 95.5 N·m About 90–96%; check the declared IEC efficiency class and motor size About 97–99% near rated load IEC 60034 documentation, thermal-rise data, insulation system, bearing details, and stated IP rating
2 Permanent-magnet synchronous motor and drive supplier 1–500 kW 15 kW at 1,500 rpm 95.5 N·m About 92–97%; confirm performance across the intended speed and load range About 97–99% near rated load Demagnetization limits, cooling requirements, temperature sensors, overload capability, and test reports
3 Industrial servo motor and servo drive supplier 0.1–100 kW 2 kW at 3,000 rpm 6.4 N·m About 90–95%; compare motor and drive losses at the actual duty cycle About 97–99% near rated load Encoder feedback, peak-torque duration, thermal limits, braking design, and positioning test results
4 Brushless DC motor and controller supplier 0.05–30 kW 1 kW at 3,000 rpm 3.2 N·m About 85–93%; efficiency depends strongly on motor size and operating point About 96–99% near rated load Controller and motor thermal protection, commutation method, bearing life data, and environmental protection rating
5 Synchronous-reluctance motor and drive supplier 1–500 kW 22 kW at 1,500 rpm 140.1 N·m About 90–96%; request efficiency maps for variable-speed operation About 97–99% near rated load Drive compatibility, torque-ripple data, thermal performance, vibration testing, and service support
6 High-speed motor and inverter supplier 5–500 kW 30 kW at 12,000 rpm 23.9 N·m About 90–96%; confirm efficiency at the specified high-speed operating point About 97–99% near rated load Maximum-speed test evidence, rotor balance grade, bearing or air-bearing design, and cooling limits
7 Electric traction motor and inverter supplier 30–300 kW 100 kW at 3,000 rpm 318.3 N·m About 93–97% near rated operation; compare the full efficiency map About 97–99% near rated load Continuous and peak ratings, duty-cycle validation, vibration and thermal tests, and applicable vehicle standards
8 Medium-voltage motor and drive supplier 200 kW–10 MW or more 500 kW at 1,500 rpm 3,183.1 N·m About 95–98% at rated load, depending on motor design and rating About 97–99% near rated load; confirm at the specified voltage and load Applicable IEC test reports, insulation coordination, partial-discharge testing, cooling design, and maintenance requirements
9 Geared motor and variable-speed drive supplier 0.1–200 kW motor power 7.5 kW motor at 1,500 rpm; 20:1 gearbox About 907 N·m at 75 rpm, assuming 95% gearbox efficiency Motor: about 90–96%; gearbox efficiency is design- and ratio-dependent About 97–99% for the drive; assess the complete motor-gearbox-drive system separately Gearbox service factor, output-bearing loads, lubrication interval, thermal rating, and declared gearbox efficiency
10 Explosion-protected motor and drive supplier 0.75–500 kW 11 kW at 1,500 rpm 70.0 N·m About 89–95%; verify the exact efficiency class and certified configuration About 97–99% where the drive is suitable for the installation Valid hazardous-area certification for the intended zone, gas or dust group, temperature class, and installation method

Calculation and comparison notes: Example torque is calculated using T (N·m) = 9,550 × P (kW) ÷ speed (rpm), rounded to one decimal place. The geared-motor example additionally assumes a 20:1 reduction and 95% gearbox efficiency. Efficiency ranges are indicative, vary with rating and test conditions, and should not be compared unless measured at the same load, speed, voltage, and temperature. Reliability has no single universal figure: compare applicable certificates, test results, operating limits, warranty terms, and service arrangements.

FAQS

How large was China’s NEV market in 2023?

China produced 9.587 million NEVs and sold 9.495 million. That is a large market, but it does not guarantee orders for every supplier.

Why doesn’t high vehicle demand guarantee supplier success?

Vehicle types, component designs, and sourcing choices vary. Suppliers also face price pressure and changing technology. Volume is only part of the picture.

What parts make up an electric drive?

An electric drive typically combines a motor, inverter, and reducer. The motor creates rotation, the inverter controls current, and the reducer adjusts speed and torque. Small details matter.

How should buyers compare motor power and torque?

Match ratings to the real duty cycle, not just catalogue peaks. Review torque across operating speeds, including repeated starts and overload periods.

What efficiency information should suppliers provide?

Request efficiency figures at several load points. Check whether results cover the motor alone or the complete drive system. Test conditions matter.

Which physical details deserve attention during evaluation?

Check cooling needs, connector placement, coolant routing, and vibration behavior. Listen for gear noise and note how quickly the unit warms under repeated loads.

How can buyers assess reliability?

Review documented operating hours, failure records, warranty terms, and thermal and vibration test results. Unsupported lifetime claims deserve caution. Real data can be imperfect.

What should a useful supplier test report include?

Send suppliers the same speed-torque profile and ambient-temperature range. Ask for sample reports and clear test conditions. A tidy spreadsheet can still miss installation details.

Conclusion

China’s 9.59 million new energy vehicle sales in 2023 highlight the growing demand for reliable electric drive systems and the suppliers that support them. An Electric Motor Drive typically brings together an electric motor, power inverter, and reducer to convert electrical energy into controlled wheel torque. Together, these components influence vehicle acceleration, energy use, packaging, and driving performance.

This overview explores how 400 V and 800 V platforms differ in their electrical architecture and application, then introduces ten leading Chinese suppliers by their product focus, system integration, and market roles—without ranking them by brand recognition alone. It also outlines practical ways to compare suppliers, including power and torque capability, operating efficiency, durability, and reliability. These factors help explain how e-drive choices can shape vehicle performance and support the varied requirements of China’s expanding NEV market.

Sienna

Sienna

Sienna is a skilled marketing professional with a deep expertise in our company’s core products and services. With a passion for innovation and detail, she plays a pivotal role in crafting insightful blog posts that not only highlight the unique features of our offerings but also provide valuable......